Research Article | | Peer-Reviewed

Quantitative Analysis of Iron Activity in Agricultural Soils Using X-ray Fluorescence Spectrometry: Comparative Study with an Undisturbed Reference Site in Niankhene, Senegal

Received: 20 July 2024     Accepted: 10 August 2024     Published: 27 August 2024
Views:       Downloads:
Abstract

An essential micronutrient for plant growth and development, iron (Fe) affects a number of physiological processes, including respiration and photosynthesis. This study compare the amounts of iron in agricultural zones and reference zones, describe the geographic distribution of iron, and assess its accessibility to cultures. The aim is to assess the deficiencies and excess soil disturbance in the Niankhène agricultural site while maintaining a stable site. Soil samples were taken at 0–20 cm and 20–40 cm depths from 47 agricultural stations and three reference points using X-ray fluorescence (XRF) spectroscopy. Significant variation in Fe concentrations was found by the research, with an average of roughly 3310.95 ppm and moderate variation between samples. An analysis conducted in comparison with reference locations revealed a widespread lack of Fe in the research area, with 85.71% of samples displaying depletion and only 14.29% displaying accumulation of Fe. This discrepancy emphasizes the necessity of focused soil management techniques to raise Niankhene's agricultural output. The results highlight how crucial it is to use site-specific soil management strategies in order to overcome Fe deficits and raise crop yields. This research highlights the possibility for establishing targeted fertilization and corrective procedures to maximize Fe availability by utilizing XRF technology for reliable soil nutrient monitoring. The study's findings offer insightful information for enhancing fertilization techniques and improving soil management techniques, which will support sustainable farming methods and increased crop yield in the area.

Published in American Journal of Modern Physics (Volume 13, Issue 3)
DOI 10.11648/j.ajmp.20241303.12
Page(s) 41-51
Creative Commons

This is an Open Access article, distributed under the terms of the Creative Commons Attribution 4.0 International License (http://creativecommons.org/licenses/by/4.0/), which permits unrestricted use, distribution and reproduction in any medium or format, provided the original work is properly cited.

Copyright

Copyright © The Author(s), 2024. Published by Science Publishing Group

Keywords

Soil, XRF, Iron (Fe), Agricultural Productivity, Fertilization Strategies

1. Introduction
A vital micronutrient for plant growth, iron (Fe) affects vital physiological processes like respiration, photosynthesis, and nitrogen fixation . It is essential to comprehend the distribution and availability of iron in agricultural soils in order to maximize crop yield and maintain sustainable agricultural practices . This is especially important in areas like Senegal's Niankhene department, where soil fertility and nutrient management have a direct bearing on agricultural sustainability and productivity. Recent developments in analytical methods have greatly enhanced the analysis of soil nutrients. X-ray fluorescence spectrometry (XRF) is one of these techniques that has become a potent tool for elemental analysis. XRF uses X-rays to precisely identify and quantify elements, including iron, without causing any damage to soil samples. . In this work, soil samples from a reference site and a research site in Niankhene are analyzed using XRF technology. The goals are to determine which sample has an iron accumulation or a carence by characterizing the spatial distribution of iron, comparing the iron activity in the study site and the reference site, and evaluating the availability of iron to crops. . It is hoped that the research's conclusions would provide insightful information on soil management techniques, such as focused fertilization methods and remediation initiatives meant to maximize iron availability and raise agricultural output in Niankhene. This report presents the results of our XRF analysis and soil sample, discusses their implications for sustainable agriculture in the area, and goes into detail about the methods used.
2. Resources and Techniques
2.1. An Explanation of the Research and the Source Website
The research location is in Niakhene, which is in the department of Tivaouane in Thiès. Dakar, the capital of Senegal, is around 184 kilometers away from the study site. The majority of the soil at the farming location is light and sandy. This sort of sandy soil has many benefits. For example, it is very permeable to both air and water, which makes drainage and aeration easier. Since the soil is porous, water can naturally percolate through it. Its high filtering capacity, however, also results in low water and nutrient retention. Furthermore, this soil type is prone to erosion brought on by rainfall or irrigation because of its low organic matter concentration.
2.2. Method of Sampling at the Study and Reference Sites
Plowed soil at the research location in Niakhene has disturbed the humus layer down to a depth of 15 cm. We used a methodical sampling technique to capture the variety in soil attributes. Within the cultivated region, a total of 47 sampling stations were set up along 7 transects. 94 sub-samples from the agricultural site were obtained by taking soil cores at two depths 0–20 cm and 20–40 cm at each sampling location. The sampling plan in detail is depicted in Figure 1, which also shows the depths and sampling points distributed throughout the farmed area. Three reference points were chosen to approximate undisturbed conditions for the reference site, which is seven kilometers away. Three sampling stations, designated as References 1, 2, and 3, were chosen to reflect undisturbed conditions for the reference site, which is situated seven kilometers away. Samples were taken at Ref. 1 down to a depth of 75 cm, yielding 15 sub-samples. In a similar vein, 53 subsamples were gathered at Reference 3 and 19 subsamples at Reference 2. All soil samples were collected, then they were all brought to the lab in plastic bags. Samples were dried, their roots removed, and then they were crushed and sieved in the laboratory in order to get them ready for further study. In order to enable reliable comparison and analysis of soil features, including iron concentration and distribution, this sampling methodology enabled full coverage of soil characteristics at both the study and reference locations.
3. X-ray Fluorescence Analysis of Samples
3.1. Experimental Approach
A silver Ag anode is used as the excitation source and an improved large-geometry detector with various filters is used as a secondary source when soil samples are directly fed into the X-ray fluorescence analyzer. A clear representation of the Niton XLT900s X-ray tube's filter setup can be found in Figure 1.
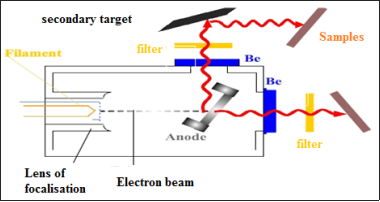
Figure 1. X-ray tube with typical excitation geometry.
The features and operational parameters of the Niton XLT900s spectrometer with various filter types are shown in table 1.
Table 1. Niton XLT900s Spectrometer specification and operating conditions.

Resolution

178 eV@ Mn Kα

Window thickness

12.7 μm Be

Excitation Tube

50KV, 40 µA maximum power 2W

Beam diameter

7mm

Filters

List of targeted elements

Excitation Source Ag

Sb, Sn, Cd, Pd, Ag, Mo, Nb, Zr, Sr, Rh, Bi, As, Se, Au, Pb, W, Zn, Cu, Re, Ta, Hf, Ni, Co, Fe, Mn, Cr, V, Ti, Th, U

Sandwich of Al, Ti and Mo

Ba, Sb, Sn, Cd, Pd, Ag

Filter of Cu

Cr, V, Ti, Ca, K

No Filter

Al, P, Si, Cl, S, Mg

3.2. The X-ray Fluorescence Principle Spectrometry
The basic idea behind X-ray fluorescence spectrometry (XRF) is to ionize atoms in a sample by applying powerful X-ray radiation. Atoms in the sample absorb energy from X-rays, which leads to the ejection of inner-shell electrons from their orbitals close to the nucleus. An electron with a higher energy level fills the vacancy that is subsequently created in the inner electron shell. The energy difference between the beginning and final states of the electron rearrangement correlates to the characteristic X-ray fluorescence photons that are released during this transition .
The emitted X-ray photons are specific to the elements present in the sample, providing a unique spectral fingerprint that reflects the elemental composition. By measuring the intensity of these fluorescence photons across different energy levels, an X-ray emission line spectrum is generated. This spectrum allows for the identification and quantification of elements in the sample based on their atomic numbers and characteristic X-ray emissions . The atomic number of the elements affects how useful XRF analysis is. When compared to heavier elements, elements with low atomic numbers (low Z) have lower X-ray fluorescence yields, which may limit the sensitivity for detecting these elements .
4. Results and Discussions
4.1. Concentrations of Fe in the Agricultural Site
The geographical distribution of iron (Fe) concentrations at depths of 0 to 20 cm in Niakhène has been mapped through elemental analysis of samples using X-ray fluorescence (XRF) technology. This analysis allows for a detailed understanding of Fe content across the agricultural site. The results of Fe concentrations (in ppm) noted Fe (1) from various samples at the Niakhène agricultural site are as follows in the table 2.
Table 2. Iron concentrations in ppm from various sample at the Niankhene site.

Samples

Fe (1) in ppm

Samples

Fe (1) in ppm

S1

4103.12±65.77

S106

3634.22±61.94

S8

4055.26±60.79

S108

2916.82±55.23

S10

2082.75±43.85

S114

2662.71±49.14

S22

2923.53±55.89

S116

3553.62±61.10

S24

2955.12±55.64

S134

3753.05±62.26

S28

3434.14±59.63

S136

2824.2±50.63

S30

3135.82±57.22

S138

3469.63±56.10

S50

2969.65±55.89

S140

3259.88±58.33

S52

3442.19±59.95

S142

3353.26±59.05

S54

3451.85±56.12

S144

3213.34±52.65

S60

4048.3±66.33

S146

4286.42±66.94

S78

3548.04±63.41

S148

3290.46±57.86

S82

2571.05±48.49

S162

4072.93±65.09

S84

3203.1±56.62

S164

3522.96±59.63

S86

3516.06±60.42

S168

2798.97±55.99

S88

2875.53±57.955

S170

3162.14±57.70

S90

2771.8±53.93

S178

3710.4±63.41

The bar chart above displays the Fe concentration (in ppm) for each sample, including error bars representing the standard deviation. This analysis shows (Figure 1) that the Fe concentration varies significantly across the samples, with the highest concentration in sample S146 and the lowest in sample S10. The standard deviations indicate the variability of measurements around the mean values for each sample. The average Fe concentration across all samples is approximately 3310.95 ppm. The standard deviation is 494.80 ppm, indicating a moderate spread of Fe concentrations around the mean. The Fe concentrations range from a minimum of 2082.75 ppm (sample S10) to a maximum of 4286.42 ppm (sample S146). This wide range suggests significant variability in Fe content across different samples. Samples with the highest Fe concentrations are S146 (4286.42 ppm) and S1 (4103.12 ppm) and the samples with the lowest Fe concentrations are S10 (2082.75 ppm) and S82 (2571.05 ppm). Samples such as S1, S8, S60, and S162 have relatively high Fe concentrations and exhibit consistent standard deviations, indicating reliable measurement consistency. On the other hand, samples like S10 and S82, with lower Fe concentrations, also have lower standard deviations, suggesting less variability in these measurements.
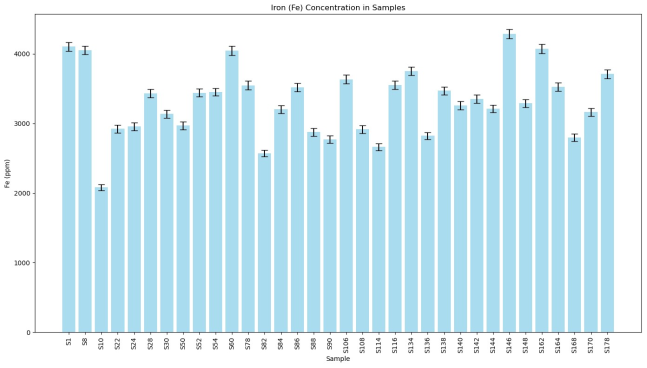
Figure 2. Distribution of iron concentration in the study site.
4.2. Concentration in the Reference Site
To compare the iron (Fe) noted Fe (2) concentrations from the Niakhène agricultural site with reference sites, we would typically refer to background Fe concentrations in similar environments or specific reference sites that have been studied and documented. These reference sites can provide a baseline or control values for Fe concentration against which the Niakhène samples can be compared. Assuming we have typical values of Fe concentrations for reference sites in similar agricultural or natural environments, here’s a synthesized presentation of these values. (In actual practice, specific reference sites and their Fe concentrations should be provided based on existing studies or environmental reports. The Descriptive Statistics for Reference Site show the mean of Fe (ppm) was 4280.9.
4.3. Presentation of Differents Phenomens
To determine whether there is accumulation or deficiency, we introduce the parameter Cor = Fe(2) - Fe(1) to identify the points that show accumulation, deficiency, or those that do not present any problems. The Cor parameter helps us to evaluate the changes in iron (Fe) concentrations between two sets of measurements, Fe (1) and Fe (2). By calculating Cor = Fe(2) - Fe(1) for each sample, we can classify the points into three categories: If Cor > 0, there a deficiency is of iron, If Cor < 0, there is an accumulation of iron, If Cor = 0, there is no significant change in iron concentration. The differents phenomens are presented in the following table.
Table 3. Differents phenomens observed in the study.

Samples

Fe (1)

Fe (2)

Cor = Fe(2) - Fe(1)

Observations

S1

4303.12

4280.90

-22.20

Accumulation

S8

4455.26

4280.90

-174.34

Accumulation

S10

2082.75

4280.90

2198.17

Deficiency

S22

2923.53

4280.90

1357.39

Deficiency

S24

2955.12

4280.90

1325.8

Deficiency

S28

3434.14

4280.90

846.78

Deficiency

S30

3135.82

4280.90

1145.1

Deficiency

S50

2969.65

4280.90

1311.27

Deficiency

S52

3442.19

4280.90

838.73

Deficiency

S54

3451.85

4280.90

829.07

Deficiency

S60

4348.3

4280.90

-68.38

Accumulation

S78

3548.04

4280.90

732.88

Deficiency

S82

2571.05

4280.90

1709.87

Deficiency

S84

3203.1

4280.90

1077.82

Deficiency

S86

3516.06

4280.90

764.86

Deficiency

S88

2875.53

4280.90

1405.39

Deficiency

S90

2771.8

4280.90

1509.12

Deficiency

S114

2662.71

4280.90

1618.21

Deficiency

S116

3553.62

4280.90

727.3

Deficiency

S134

3753.05

4280.90

527.87

Deficiency

S136

2824.2

4280.90

1456.72

Deficiency

S138

3469.63

4280.90

811.29

Deficiency

S140

3259.88

4280.90

1021.04

Deficiency

S142

3353.26

4280.90

927.66

Deficiency

S144

3213.34

4280.90

1067.58

Deficiency

S146

4286.42

4280.90

-5.5

Accumulation

S148

3290.46

4280.90

990.46

Deficiency

S162

4372.93

4280.90

-92.01

Accumulation

S164

3522.96

4280.90

757.96

Deficiency

S168

2798.97

4280.90

1481.95

Deficiency

S170

3162.14

4280.90

1118.78

Deficiency

S178

3710.4±63.41

4280.90

570.52

Decifiency

4.4. Analysis and Interpretation of Results
The table presents data on iron (Fe) levels at two different times for various samples. The difference between these levels, labeled as Cor, indicates whether there has been an accumulation or deficiency of iron over time. Here's a detailed analysis and discussion based on the provided data. The majority of the samples (85.71%) exhibit iron deficiency, while a minority (14.29%) show accumulation. This indicates a general trend of decreasing iron levels over the observed period. This observation aligns with studies that highlight iron deficiency as a common issue in various soils due to factors like high pH, calcareous conditions, and poor soil management practices . The Cor values among the deficiency samples are substantial, indicating significant iron loss. The highest recorded deficiency is 2198.15 (Sample S10), suggesting severe depletion. Such severe deficiencies can lead to reduced plant growth, chlorosis, and overall poor crop yields . The accumulation values are relatively minor compared to the deficiencies, with the highest accumulation being -5.52 (Sample S146). This suggests that iron accumulation, when it occurs, is minimal and less impactful . The consistent deficiency across various samples indicates a systemic issue rather than isolated incidents. This can be due to uniform soil conditions, climatic factors, or widespread agricultural practices that limit iron availability. The bar chart clearly shows Figure 3 that the number of samples with iron deficiency (30) is significantly higher than those with accumulation (5). This highlights a prevalent issue of iron deficiency across the samples . Climatic factors, such as temperature and rainfall patterns, also influence soil iron dynamics and can contribute to iron deficiencies. Iron deficiency in soil can have several adverse effects on crop health and yield: Iron is crucial for chlorophyll synthesis and enzyme function. Deficiency can lead to stunted growth and reduced biomas . A common symptom of iron deficiency is chlorosis, characterized by yellowing of leaves due to impaired chlorophyll production. Prolonged iron deficiency can result in significant yield losses, impacting agricultural productivity and profitability.
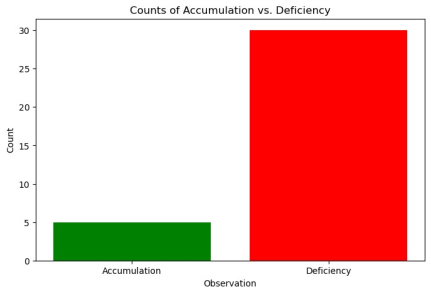
Figure 3. Counts of accumulation vs deficiency.
The histogram displays the distribution of Cor values, illustrating the range and frequency of iron accumulation and deficiency: The majority of Cor values fall on the positive side, indicating deficiency; A small number of samples have negative Cor values, indicating accumulation; The distribution of deficiency values is wide, ranging from 500 to over 2000, showing Figure 4 varying degrees of iron deficiency severity. The box plot compares the Cor values for accumulation and deficiency: Accumulation: The values are close to zero, with minimal variation.
This indicates that when accumulation occurs, it is relatively minor. Deficiency: The values show Figure 5 a much broader range and higher median, indicating significant and varying levels of iron deficiency across the samples. The presence of outliers further emphasizes the severity in some cases.
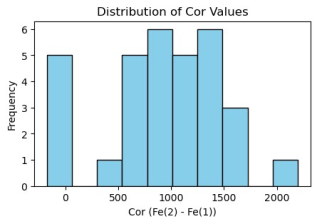
Figure 4. Distribution of Cor values.
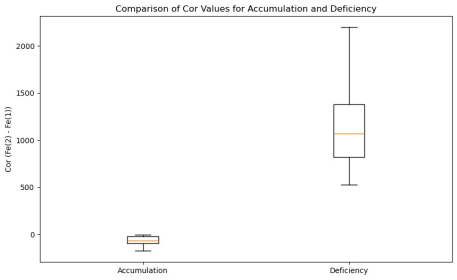
Figure 5. Comparison of cor values for accumulation and deficiency.
4.5. Potentiels Causes and Implications
Environmental Factors: Widespread iron deficiency could result from environmental conditions such as alkaline soils, waterlogging, or poor soil aeration, which reduce iron availability to plants.
Agricultural Practices: Farming practices, including improper fertilization, over-irrigation, or the use of iron-chelating pesticides, might impact soil iron levels. Practices that do not replenish soil nutrients effectively can lead to cumulative deficiencies.
Plant Variety: Different plants have varying abilities to absorb and retain iron. The variations in deficiency severity among the samples could be due to different plant species or cultivars with distinct iron uptake capabilities.
5. Physics-Based Solutions for Iron Deficiency and Accumulation
5.1. Soil Water Movement and Irrigation Management
Proper irrigation management is crucial for preventing both iron accumulation (due to waterlogging) and deficiency (due to inadequate moisture). The following formulas from fluid dynamics and soil physics can help optimize irrigation practices. Darcy's Law for Water Flow in Soil:
Q=-K.A.dhdz(1)
Q: Water flow rate (m³/s); K: Hydraulic conductivity of the soil (m/s); A: Cross-sectional area through which water flows (m²); dhdz: Hydraulic gradient (change in head per unit distance).
Darcy's Law is a cornerstone of hydrogeology and soil physics, providing a quantitative description of the flow of fluids through porous media. Named after Henry Darcy, the law is fundamental for understanding and predicting water movement in soils, which is critical for agricultural practices, groundwater management, and environmental engineering. Darcy's Law is a foundational principle for understanding and managing water flow in soils. Its application is crucial for effective agricultural practices, groundwater management, and environmental engineering.
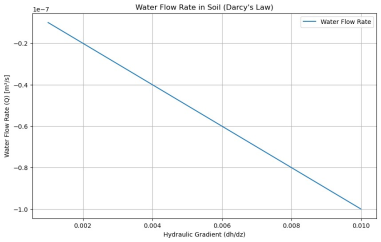
Figure 6. Darcy's Law for Water Flow in Soil.
5.2. Soil pH and Buffering Capacity
Maintaining optimal soil pH is crucial for iron availability. The buffering capacity of soil indicates its ability to resist changes in pH. The formula for buffering capacity (BC) can be given as:
BC= Acid/BasepH(2)
ΔAcid/Base: Amount of acid or base added (mol); ΔpH: Change in pH
Applying this concept helps determine the amount of lime needed to adjust soil pH to optimal levels for iron availability. In soil, buffering capacity acts similarly by absorbing or releasing ions to maintain pH stability. Soils with high buffering capacity are like a large sponge that can absorb more changes in pH without significant swings.
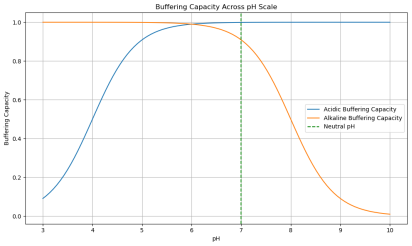
Figure 7. Buffering capacity across pH Scale.
5.3. Nutrient Transport in Soil
The transport of iron and other nutrients in soil can be modeled using Fick's Law of Diffusion, which describes the flux of ions due to concentration gradients. The Fick’s first Law whrote by the following formula
J=-DdCdx(3)
J: Diffusive flux (mol/m²·s); D: Diffusion coefficient (m²/s); dCdx: Concentration gradient (mol/m³ per m)
This formula helps understand how iron moves through soil, aiding in the design of efficient fertilization strategies.
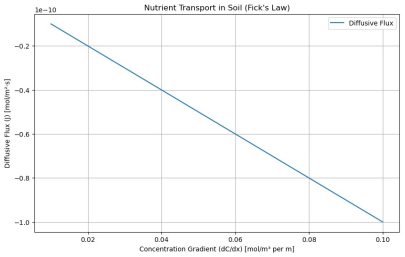
Figure 8. Darcy's Law and Fick's Law.
5.4. Application of Chelated Iron Fertilizers
To calculate the precise amount of chelated iron fertilizer needed, we use the following formula, considering the target iron level, current level, and fertilizer efficiency. The formula for the Fertilizer Requirement was:
Ferequired=Target Fe-Current Fe×soil volumeFertilizer Efficiency(4)
Ferequired: Amount of chelated iron fertilizer required (kg); Target Fe: Desired iron concentration in soil (mg/kg); Current Fe: Current iron concentration in soil (mg/kg); Soil Volume: Volume of soil to be treated (m³); Fertilizer Efficiency: Efficiency of the applied fertilizer (fraction).
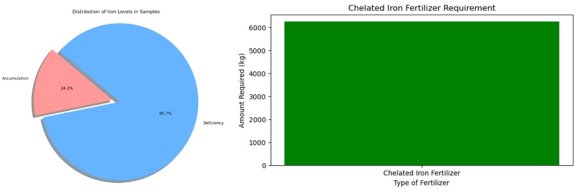
Figure 9. Distribution of iron and chelated iron fertilizer.
6. Conclusion
X-ray fluorescence (XRF) spectrometry was successfully applied in this work to offer a thorough examination of soil iron activity in agricultural samples from Niankhene. The findings show that there is a considerable variance in iron contents among the samples, pointing to both iron buildup and deficient regions. The majority of the soils had an iron deficit, which emphasizes the necessity of specific soil amendments to increase crop output. However, a small number of samples had iron accumulation, indicating the need for routine soil monitoring to avert any potential toxicity problems. The significance of site-specific soil management techniques in maximizing agricultural productivity in Niankhene is highlighted by these results. Achieving balanced soil nutrition can be facilitated by putting plans into practice including applying iron fertilizers to regions that lack it and conducting routine monitoring in places where accumulation has occurred. In addition to offering helpful guidelines for future research, this study helps farmers and agricultural planners in Niankhene increase crop yields and soil fertility. All things considered, XRF spectrometry has shown to be a useful technique for analyzing soil, providing in-depth knowledge about soil iron activity that can guide improved farming methods. Future research ought to think about broadening the focus to incorporate additional vital nutrients and investigating the long-term effects of customized soil management techniques on crop productivity and soil health in the area.
Abbreviations

XRF

X-Ray Fluorescence

ppm

Parts Per Million

Author Contributions
Djicknack Dione: Formal Analysis, Methodology, Software, Writing – original draft, Writing – review & editing
Papa Macoumba Faye: Methodology, Sampling
Oumar Ndiaye: Software, Writing – review & editing
Nogaye Ndiaye: Writing – review & editing
Moussa Hamady Sy: Writing – review & editing
Alassane Traoré: Sampling, Methodology
Ababacar Sadikhe Ndao: Conceptualization, Validation, Writing – review & editing
Conflicts of Interest
The authors declare no conflicts of interest.
References
[1] Marschner, H. (2021). Marschner's Mineral Nutrition of Higher Plants (4th ed.). Academic Press.
[2] Rengel, Z. (2020). Handbook of Plant Nutrition (3rd ed.). CRC Press.
[3] Kumar, A., Pandey, S., & Pandey, S. (2018). Iron nutrition in plants and rhizospheric microorganisms. Environmental Microbiology Reports, 10(4), 490-504.
[4] López-Vizcaíno, R., Garrido, I., Faria, P., & Abreu, M. M. (2017). Soil nutrient management and sustainable crop production: A review. Journal of Soils and Sediments, 17(6), 1475-1490.
[5] Lombi, E., Susini, J., & Hossain, M. A. (2018). High-resolution X-ray fluorescence microscopy in environmental biogeochemistry. Environmental Science & Technology, 52(3), 1455-1467.
[6] Akhtar, M. J., & Paliwal, L. J. (2018). Elemental analysis in soil and sediment samples using energy dispersive X-ray fluorescence spectrometry. Journal of Environmental Science and Health, Part A, 53(1), 1-19.
[7] Mekonnen, Z., & Schreck, E. (2018). Assessment of heavy metal pollution in soils from Addis Ababa (Ethiopia) using pollution indices and multivariate statistical techniques. Environmental Monitoring and Assessment, 190(11), Article 657.
[8] Rodrigues, S. M., et al. (2013). Soil Pollution: From Monitoring to Remediation. Springer.
[9] Palmer, P. T., Jacobs, R., Baker, P. E., Ferguson, K., & Webber, S. (2009). "Use of field-portable XRF analyzers for rapid screening of toxic elements in FDA-regulated products." Journal of Agricultural and Food Chemistry, 57(6), 2605-2613.
[10] Robinson, A., Harroun, S., Bergman, J., & Brosseau, C. (2012). "Portable electrochemical surface-enhanced Raman spectroscopy system for routine spectroelectrochemical analysis." Analytical Chemistry, 84(4), 1760-1764.
[11] Malik, L. A., Bashir, A., Qureashi, A., & Pandith, A. H. (2019). "Detection and removal of heavy metal ions: a review." Environmental Chemistry Letters, 17(4), 1495-1521.
[12] Gopinath, K. P., Vo, D.-V. N., Gnana Prakash, D., Adithya Joseph, A., Viswanathan, S., & Arun, J. (2021). "Environmental applications of carbon-based materials: a review." Environmental Chemistry Letters, 19(2), 557-582.
[13] Zhao, X., Li, Y., Yang, Y., & Li, X. (2020). "Effects of Soil pH and Calcareous Conditions on Iron Availability and Plant Growth: A Review." Agricultural Systems, 182, 102855.
[14] Graham, R. D., & Welch, R. M. (2018). "A Review of Iron Deficiency in Crops and the Role of Soil Management." Field Crops Research, 223, 60-72.
[15] Liu, M., Wu, L., & Liu, X. (2021). "Iron Accumulation and Its Implications for Soil Fertility and Crop Production." Soil Science Society of America Journal, 85(3), 739-752.
[16] Mortvedt, J. J. (1991). "Correcting iron deficiencies in annual and perennial plants: Present technologies and future prospects." Plant and Soil, 130(1-2), 273-279.
[17] Havlin, J. L., Beaton, J. D., Tisdale, S. L., & Nelson, W. L. (2005). Soil Fertility and Fertilizers: An Introduction to Nutrient Management. Pearson Prentice Hall.
Cite This Article
  • APA Style

    Dione, D., Faye, P. M., Ndiaye, O., Ndiaye, N., Sy, M. H., et al. (2024). Quantitative Analysis of Iron Activity in Agricultural Soils Using X-ray Fluorescence Spectrometry: Comparative Study with an Undisturbed Reference Site in Niankhene, Senegal. American Journal of Modern Physics, 13(3), 41-51. https://doi.org/10.11648/j.ajmp.20241303.12

    Copy | Download

    ACS Style

    Dione, D.; Faye, P. M.; Ndiaye, O.; Ndiaye, N.; Sy, M. H., et al. Quantitative Analysis of Iron Activity in Agricultural Soils Using X-ray Fluorescence Spectrometry: Comparative Study with an Undisturbed Reference Site in Niankhene, Senegal. Am. J. Mod. Phys. 2024, 13(3), 41-51. doi: 10.11648/j.ajmp.20241303.12

    Copy | Download

    AMA Style

    Dione D, Faye PM, Ndiaye O, Ndiaye N, Sy MH, et al. Quantitative Analysis of Iron Activity in Agricultural Soils Using X-ray Fluorescence Spectrometry: Comparative Study with an Undisturbed Reference Site in Niankhene, Senegal. Am J Mod Phys. 2024;13(3):41-51. doi: 10.11648/j.ajmp.20241303.12

    Copy | Download

  • @article{10.11648/j.ajmp.20241303.12,
      author = {Djicknack Dione and Papa Macoumba Faye and Oumar Ndiaye and Nogaye Ndiaye and Moussa Hamady Sy and Alassane Traoré and Ababacar Sadikhe Ndao},
      title = {Quantitative Analysis of Iron Activity in Agricultural Soils Using X-ray Fluorescence Spectrometry: Comparative Study with an Undisturbed Reference Site in Niankhene, Senegal
    },
      journal = {American Journal of Modern Physics},
      volume = {13},
      number = {3},
      pages = {41-51},
      doi = {10.11648/j.ajmp.20241303.12},
      url = {https://doi.org/10.11648/j.ajmp.20241303.12},
      eprint = {https://article.sciencepublishinggroup.com/pdf/10.11648.j.ajmp.20241303.12},
      abstract = {An essential micronutrient for plant growth and development, iron (Fe) affects a number of physiological processes, including respiration and photosynthesis. This study compare the amounts of iron in agricultural zones and reference zones, describe the geographic distribution of iron, and assess its accessibility to cultures. The aim is to assess the deficiencies and excess soil disturbance in the Niankhène agricultural site while maintaining a stable site. Soil samples were taken at 0–20 cm and 20–40 cm depths from 47 agricultural stations and three reference points using X-ray fluorescence (XRF) spectroscopy. Significant variation in Fe concentrations was found by the research, with an average of roughly 3310.95 ppm and moderate variation between samples. An analysis conducted in comparison with reference locations revealed a widespread lack of Fe in the research area, with 85.71% of samples displaying depletion and only 14.29% displaying accumulation of Fe. This discrepancy emphasizes the necessity of focused soil management techniques to raise Niankhene's agricultural output. The results highlight how crucial it is to use site-specific soil management strategies in order to overcome Fe deficits and raise crop yields. This research highlights the possibility for establishing targeted fertilization and corrective procedures to maximize Fe availability by utilizing XRF technology for reliable soil nutrient monitoring. The study's findings offer insightful information for enhancing fertilization techniques and improving soil management techniques, which will support sustainable farming methods and increased crop yield in the area.
    },
     year = {2024}
    }
    

    Copy | Download

  • TY  - JOUR
    T1  - Quantitative Analysis of Iron Activity in Agricultural Soils Using X-ray Fluorescence Spectrometry: Comparative Study with an Undisturbed Reference Site in Niankhene, Senegal
    
    AU  - Djicknack Dione
    AU  - Papa Macoumba Faye
    AU  - Oumar Ndiaye
    AU  - Nogaye Ndiaye
    AU  - Moussa Hamady Sy
    AU  - Alassane Traoré
    AU  - Ababacar Sadikhe Ndao
    Y1  - 2024/08/27
    PY  - 2024
    N1  - https://doi.org/10.11648/j.ajmp.20241303.12
    DO  - 10.11648/j.ajmp.20241303.12
    T2  - American Journal of Modern Physics
    JF  - American Journal of Modern Physics
    JO  - American Journal of Modern Physics
    SP  - 41
    EP  - 51
    PB  - Science Publishing Group
    SN  - 2326-8891
    UR  - https://doi.org/10.11648/j.ajmp.20241303.12
    AB  - An essential micronutrient for plant growth and development, iron (Fe) affects a number of physiological processes, including respiration and photosynthesis. This study compare the amounts of iron in agricultural zones and reference zones, describe the geographic distribution of iron, and assess its accessibility to cultures. The aim is to assess the deficiencies and excess soil disturbance in the Niankhène agricultural site while maintaining a stable site. Soil samples were taken at 0–20 cm and 20–40 cm depths from 47 agricultural stations and three reference points using X-ray fluorescence (XRF) spectroscopy. Significant variation in Fe concentrations was found by the research, with an average of roughly 3310.95 ppm and moderate variation between samples. An analysis conducted in comparison with reference locations revealed a widespread lack of Fe in the research area, with 85.71% of samples displaying depletion and only 14.29% displaying accumulation of Fe. This discrepancy emphasizes the necessity of focused soil management techniques to raise Niankhene's agricultural output. The results highlight how crucial it is to use site-specific soil management strategies in order to overcome Fe deficits and raise crop yields. This research highlights the possibility for establishing targeted fertilization and corrective procedures to maximize Fe availability by utilizing XRF technology for reliable soil nutrient monitoring. The study's findings offer insightful information for enhancing fertilization techniques and improving soil management techniques, which will support sustainable farming methods and increased crop yield in the area.
    
    VL  - 13
    IS  - 3
    ER  - 

    Copy | Download

Author Information
  • Institute Technologies of Nuclear Applied, Cheikh Anta Diop University, Dakar, Senegal; Department of Physics, Faculty of Sciences and Technologies, Cheikh Anta Diop University, Dakar, Senegal

  • Institute Technologies of Nuclear Applied, Cheikh Anta Diop University, Dakar, Senegal; Department of Physics, Faculty of Sciences and Technologies, Cheikh Anta Diop University, Dakar, Senegal

  • Institute Technologies of Nuclear Applied, Cheikh Anta Diop University, Dakar, Senegal; Department of Physics, Faculty of Sciences and Technologies, Cheikh Anta Diop University, Dakar, Senegal

  • Institute Technologies of Nuclear Applied, Cheikh Anta Diop University, Dakar, Senegal; Department of Physics, Faculty of Sciences and Technologies, Cheikh Anta Diop University, Dakar, Senegal

  • Institute Technologies of Nuclear Applied, Cheikh Anta Diop University, Dakar, Senegal; Department of Physics, Faculty of Sciences and Technologies, Cheikh Anta Diop University, Dakar, Senegal

  • Institute Technologies of Nuclear Applied, Cheikh Anta Diop University, Dakar, Senegal; Department of Physics, Faculty of Sciences and Technologies, Cheikh Anta Diop University, Dakar, Senegal

  • Institute Technologies of Nuclear Applied, Cheikh Anta Diop University, Dakar, Senegal; Department of Physics, Faculty of Sciences and Technologies, Cheikh Anta Diop University, Dakar, Senegal

  • Abstract
  • Keywords
  • Document Sections

    1. 1. Introduction
    2. 2. Resources and Techniques
    3. 3. X-ray Fluorescence Analysis of Samples
    4. 4. Results and Discussions
    5. 5. Physics-Based Solutions for Iron Deficiency and Accumulation
    6. 6. Conclusion
    Show Full Outline
  • Abbreviations
  • Author Contributions
  • Conflicts of Interest
  • References
  • Cite This Article
  • Author Information